On the rise in Latvia: shadow economy biggest since 2011
The results of the Shadow Economy Index for the Baltic countries presented today by the Stockholm School of Economics in Riga (SSE Riga) show that in 2020 the shadow economy in Latvia grew by 1.6%, reaching 25.5% of the national gross domestic product (GDP). According to the research performed as part of the Index, which has been published since 2010, it was the highest level of shadow economy in the country since 2011, when it was 30.2% of Latvia’s GDP.
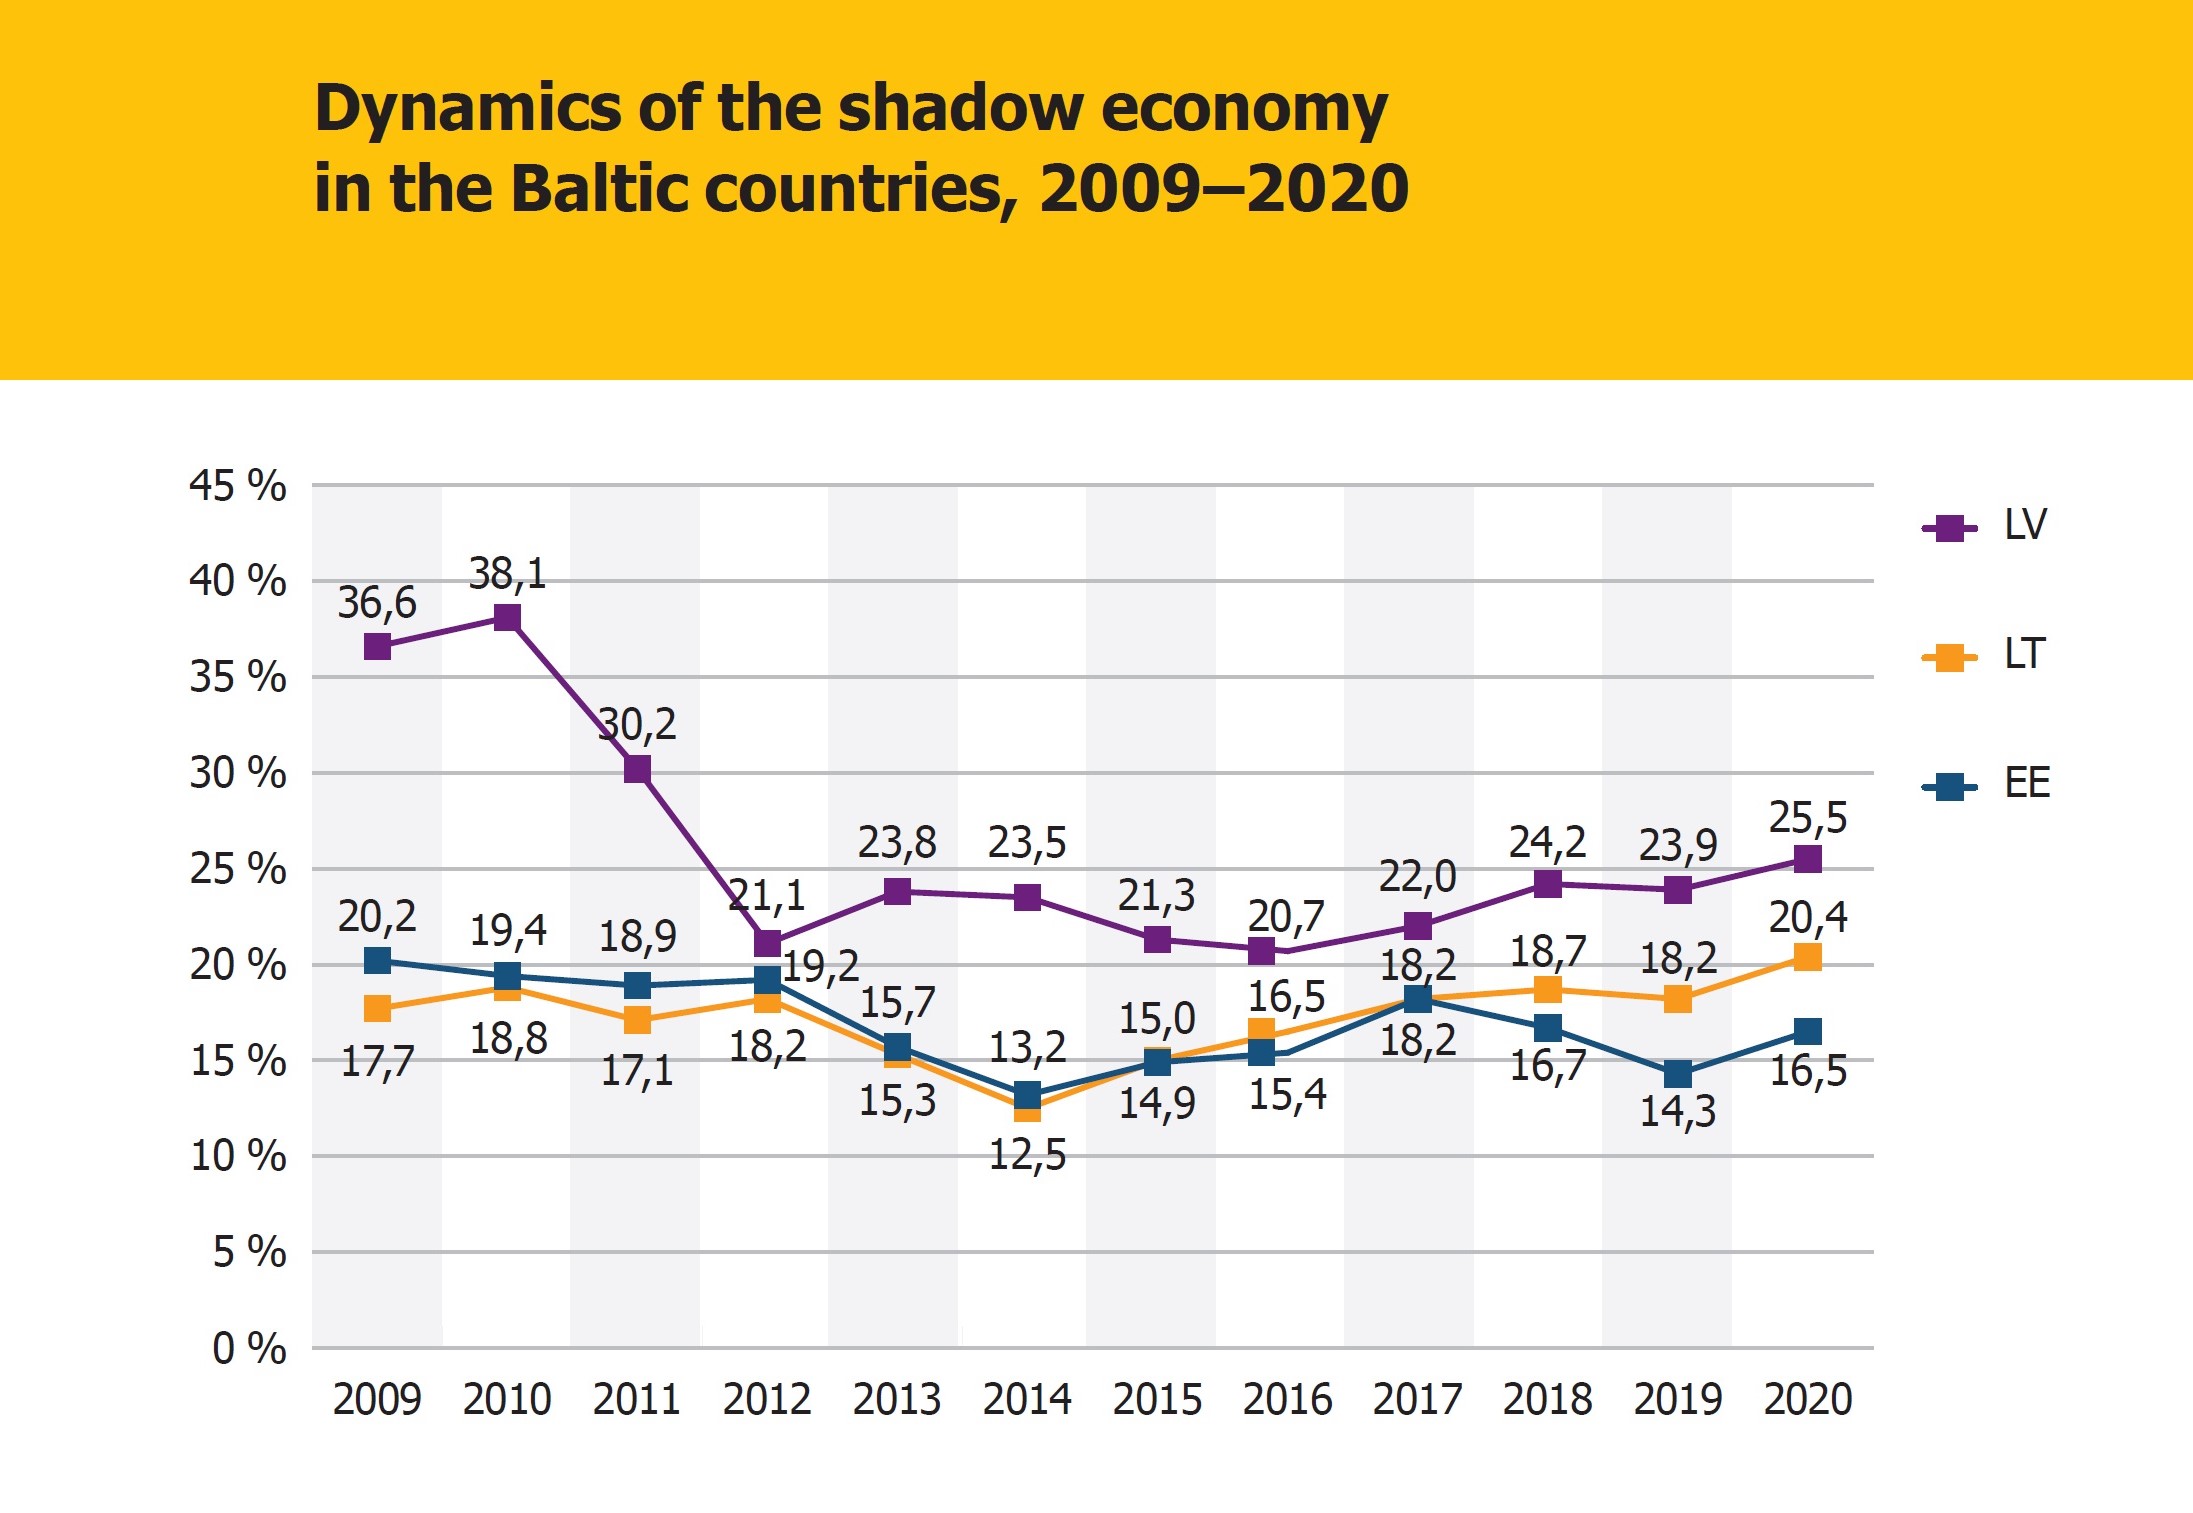
Based on the estimates, the size of the shadow economy showed a rising trend in 2016–2018: 20.7% of Latvia’s GDP in 2016, 22.0% in 2017, and 24.2% in 2018. While there was a small reduction in the shadow economy in 2019 (down to 23.9% of the GDP), recent data show that the overall trend persists, and in 2020, the shadow economy in Latvia continued growing, up to 25.5% of the national GDP. This 2020 increase has also been observed in the other Baltic states, where, year-on-year, the shadow economy grew by 2.2%, reaching 16.5% of the GDP in Estonia, and 20.4%, in Lithuania. For Lithuania, this is the highest level of shadow economy since 2009 when the first shadow economy study of this kind took place in the Baltics. Meanwhile, in Estonia, the 2020 shadow economy indicators returned to approximately their 2018 levels, with 16.7% of GDP.
SSE Riga professor Dr Arnis Sauka, the author of the study, highlighted that ‘Right now, it’s somewhat difficult to judge how much the Covid-19 pandemic affected the shadow economy indicators for 2020. However, similarly to the previous year’s study, we can conclude with certainty that despite the efforts of policymakers, they haven’t been able to reduce the size of the shadow economy in Latvia, at least significantly, since 2012. Unfortunately, there was no substantial shadow economy reduction even during the period of economic growth in Latvia: a situation when you would expect such a reduction, with the idea that businesses do better and are better motivated to pay tax. So it comes as no surprise that the shadow economy grows if the overall economy is going through tough times.’
The results of the study show that in 2020, envelope wages were still the biggest component of the shadow economy in both Latvia, where they accounted for 46.9% of the shadow economy (44.1% in 2019), and Estonia, with 40.3% (43.0% in 2019).
Undeclared income made up 29.9% of the shadow economy in Latvia (32.0% in 2019), and undeclared employees accounted for 23.2% (23.9% in 2019). For Lithuania, the biggest components of the shadow economy in 2020 were envelope wages and undeclared income (amounting to 37.7% together), followed by undeclared employees (24.7%).
Professor Sauka points out that envelope wages continue to be the main fuel for Latvia’s shadow economy, explaining the difference in its size when compared to those of the other Baltic states: ‘The average percentage of envelope wages, that is, wages that businesses hide from the government, showed a year-on-year increase in 2020 in all the three Baltic states; however, the rise was particularly high in Latvia. Namely, the amount of envelope wages in Latvia went up to 23.5% in 2020 (a 1.2% increase compared to 2019), whereas in Lithuania it was 15.3% (a 1.2% rise), and in Estonia, 13.2% (1.7%).’ The study also shows that undeclared income has risen in all of the Baltics as well. The average percentage of income that businesses in Latvia hide from the government rose by 1.4% in 2020, reaching 18.0%; in Lithuania this increase was 1.4% (up to 15.8%), and in Estonia, 1.0% (11.6%). At the same time, the rate of undeclared employees (i.e. the average percentage of those employed without an employment contract) in Latvia remained the same in 2019 and 2020, at 10.9%, whereas it grew 1.0% in Lithuania (up to 9.3%), and somewhat significantly grew in Estonia (with 3.3% and 9.0%).
The results of the study indicate that in 2020, the overall level of bribery (i.e. the percentage of income unofficially paid by businesses as ‘grease money’) rose by 0.2% year-on-year in Latvia, reaching 8.3%, and fell by 0.1% in Lithuania (down to 8.4%). Despite the overall level of bribery being lower in Estonia compared to the other two Baltic states, recent research data reveal a negative trend there as well. The average percentage of contract amounts paid to obtain government orders (kickback) is the highest in Latvia (6.9% in 2020, compared to 5.9% in 2019), followed by Lithuania (5.6% in 2020, compared to 8.3% in 2019) and Estonia (3.9% and 1.4%, respectively).
The highest levels of shadow economy in Latvia were observed in Kurzeme, Riga Region and Vidzeme. In terms of economic sectors, construction was still the biggest contributor to Latvia’s shadow economy (28.7% in 2020), followed by wholesale trade (25.3%), services (24.9%), retail (23.9%) and manufacturing (23.0%).
When it comes to the opinions that businesses in the Baltics profess of the activities of the State Revenue Service (SRS), they are still relatively satisfied. However, between 2019 and 2020, the rate of such satisfaction in Latvia fell from 3.50 to 3.41 (on a scale of 1 to 5, where 5 stands for ‘very satisfied’). ‘It’s worth noting here that according to the results of the study, the satisfaction of Latvia’s businesses with the SRS was rising between 2016 and 2019,’ professor Sauka emphasised. The study also reveals a slight improvement in the opinion concerning the national tax policy, and less satisfaction in what pertains to law governing business activities.
Its results also shows that newer businesses are more prone to engage in informal activities than older ones are. ‘One possible explanation to both of these trends is that smaller and younger companies use tax evasion as a tool to compete with bigger and more experienced competitors. This demonstrates how critical it is to have a comprehensive national policy to support small and new businesses,’ professor Sauka said.
Discussing the previous year’s results and how they compare to the latest data, professor Sauka said: ‘Back then and still today we pointed out various problems fuelling the shadow economy, such as businesses not being confident of the government’s ability to properly allocate taxpayer money, corruption scandals, and situations when envelope wages were punished with unreasonably small fines. We also noted the lack of foreseeability in the system and general certainty in the business environment, the communication between policymakers and businesses, and the general public, in what pertains, for example, to various services the government provides, such as education, healthcare, business incentives and benefits for the more vulnerable social groups. All of these factors could have a general strengthening effect on the shadow economy, especially in combination with the Covid-19 pandemic. Overall, given the shadow economy trends we’ve seen in the last 8 years, and the economic situation we have now, it is likely that the size of Latvia’s shadow economy will continue rising in the coming 2–3 years.’
About Shadow Economy Index for the Baltic Countries
SSE Riga carries out its ‘Shadow Economy Index for the Baltic countries’ study once a year, surveying businesses in the Baltic states. The authors of the study are the head of the SSE Riga Centre for Sustainable Business, professor Dr Arnis Sauka and SSE Riga professor Dr Tālis Putniņš. In order to estimate the size of the shadow economy as a percentage of GDP, the index includes calculations of undeclared business income, unregistered/hidden employees, as well as undeclared envelope wages.
16.06.2021. Ēnu ekonomikas konferences video ieraksts latviešu valodā:
16.06.2021. Video recording of the Shadow Economy Conference (interpretation in English):
This study was co-financed as part of the project VPP-FM-2020/1-0005 ‘Shadow Economy in Latvia’ (RE: SHADE) of the State Research Programme ‘Reduction of the Shadow Economy for the Provision of Sustainable Development of the State’.